THERMAL Protection System (TPS) Status Awareness Tool (T-SAT)
Tietronix developed T-SAT as a tool to for the Mission Management Team’s (MMT) response to the return to flight (RTF) recommendations of the CAIB. Using the T-SAT tool, the MMT has an integrated view of the information reported from various data providers regarding the Thermal Protection System (TPS) during a shuttle mission.
T-SAT provides a web based submission mechanism for domain experts to report information and an integrated status for management to assess the status of the TPS. The T-SAT tool provides collection, assembly, synthesis and reporting mechanisms for data. In addition T-SAT provides synthesized data displays, drill-down data displays, status displays and access to the actual completed reports and associated information.
T-SAT for STS-114
During STS-114, T-SAT provided an integrated view of all TPS assessment tasks and report information.
Users could upload reports regarding debris and damage observations either manually or automatically. T-SAT damage reports were uploaded automatically by a Damage Assessment Team tool and damage displayed in 2D views of the shuttle.
T-SAT displays mission and vehicle, and determines flight day and MET clock dynamically. T-SAT also indicates to users when new data arrives. Users can annotate plot views.
This information was available to all authorized users using a web browser.
The development, testing, and deployment of the T-SAT tool followed best software practices and was fully documented throughout. T-SAT was designed and built to be administrated and configured remotely by administrator login credentials.
- Asset Status
- Ascent Reports
- Inspection Reports
- Debris Integration
- Debris Log
- Damage Log
- Damage Plot
T-SAT integrates web based server technologies in JBoss for Java Server Pages (JSP), Java, an SQL-92 compliant database, Adobe Scalable Vector Graphics (SVG), XML input dictionaries and XML formatted data, browser based Java Script for advanced user interface controls, new data indicators, automatic data refresh, advanced remote configuration and administration.
T-SAT includes advance printing techniques for its graphics and data. In addition to T-SAT there are report tools that allow for automatic generation of T-SAT content in Word documents.
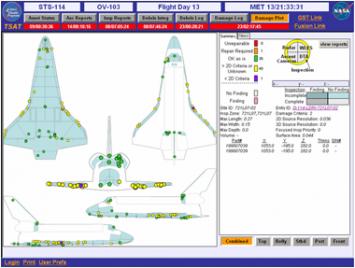
Damage Plot Specific Damage Information
The color of the dot is determined by its inspection status, which depends on the status assigned. When a specific damage is selected on the 2D view, the large dot and the data fields on the right hand side of the display indicate additional data for that damage site. The outer ring of the large dot shows the inspection status, so it is the same color as the small dot on the 2D view. The interior of the large dot is divided into quadrants which indicate whether there were any findings associated with this damage from Radar, WLES, DTA or Ascent Camera reports. A rose fill indicates there was a finding, while a grey fill indicates no finding. This finding status is manually set by SE&I Imagery. The legend for the dot coloring is always shown on the right hand side of the display.
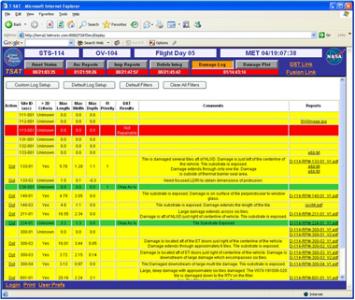
Damage Log Display
The Damage Log Display shows in a tabular format the damage observations collected by the TIIMS database and sent automatically to TSAT, or entered manually by the I-Squared team. Similar to the damage plot, the background of the damage row is colored to indicate inspection status. If the DAT Results is “Unrepairable”, the row is red; if the DAT Results is “Repair Required”, the row is orange; if the DAT Results is “OK”, the row is green.